Wide-Area Monitoring
Problem
Electrical power grid operation is growing in complexity, and the threat of catastrophic outages has led to new regulatory standards requiring that power grid operators have wide-area views of the grid.
I designed and evaluated wide-area visualizations to help operators monitor wide areas of the North American power grid, both within and outside of their own jurisdictions.
Impact
Working with end users, IT developers, senior management, and a fellow human factors researcher, I recommended UX improvements to the industry partner, conducted a work analysis, and set up the foundation for their operational human performance initiative.
The design and evaluation process was published in Ergonomics in Design, and the article was awarded the Ergonomics in Design 2017 Best Article Award. I presented the paper at the HFES Annual Meeting in 2018. We also presented the industry collaboration at the NERC Human Performance Conference, and published a conference paper and book chapter.
Process
Knowledge-Gathering
I conducted critical incident interviews with 8 current power grid operators, in a format adapted from the Critical Incident Technique (Flanagan 1954). Questions focused on past incidents that operators experienced first-hand in the control room, with the goal of designing to avoid past pitfalls. A total of 22 past incidents were recounted, and 2 top recurring issues were data unobserved (4 incidents) and unclear consequences of an action (3 incidents).
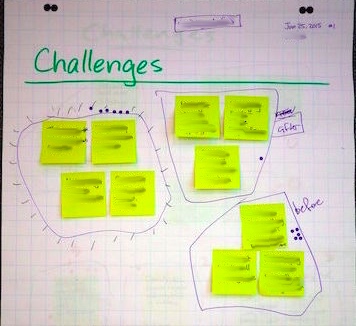
My colleague and I led focus group sessions with 6 crews of 7 operators each, where crews discussed past incidents while drawing from the experiences of the entire crew that dealt with the incident. At the end of the session, we handed out a questionnaire on control room ergonomics and software tool development.

Throughout this project, we did field studies in the control room over a period of 60+ non-consecutive days, to see how operators dealt with real-time events. The extensive knowledge-gathering process helped us understand operators’ workflows, their problem-solving methods, and usability issues that they face. The process also helped narrow the scope of my research to target the lack of wide-area monitoring visibility among operators’ tools.
Analysis
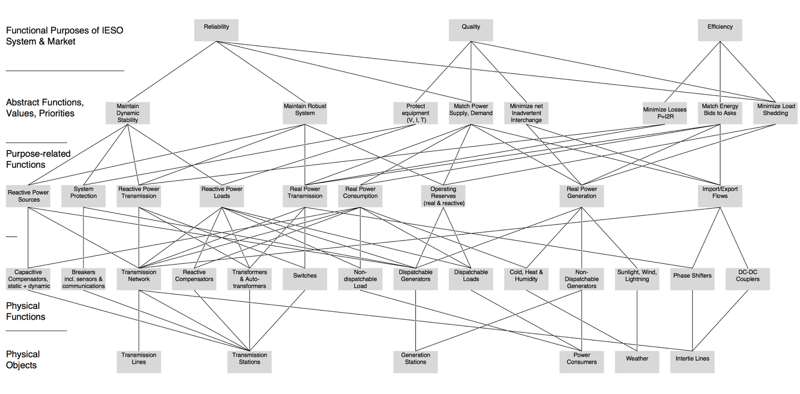
We analyzed our findings from the knowledge-gathering (above) in addition to a literature review. We conducted a Work Domain Analysis (WDA) of power grid operations, which has been published as a chapter of Cognitive Work Analysis: Applications, Extensions and Future Directions. The WDA was a way to map out functional relationships between different elements of the power grid, and at different levels of abstraction as operators manage the power grid.

I used the WDA to develop information requirements for designing wide-area monitoring visualizations for power grid operation. These information requirements included what measures operators could use to control a particular element, and what the operating constraints were for those measures.
Design and Validation
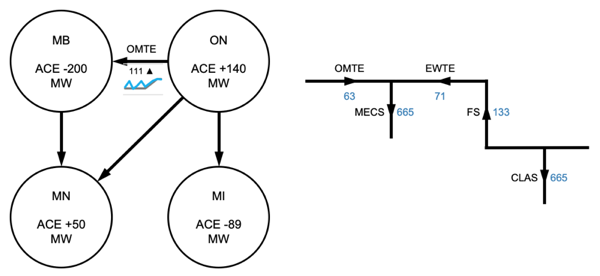
I translated the information requirements to low-fidelity wireframes, then conducted informal tabletop feedback discussions with 4 operators individually. They provided feedback on the preliminary concepts and details on their information needs, so that I could iterate on those wireframes.

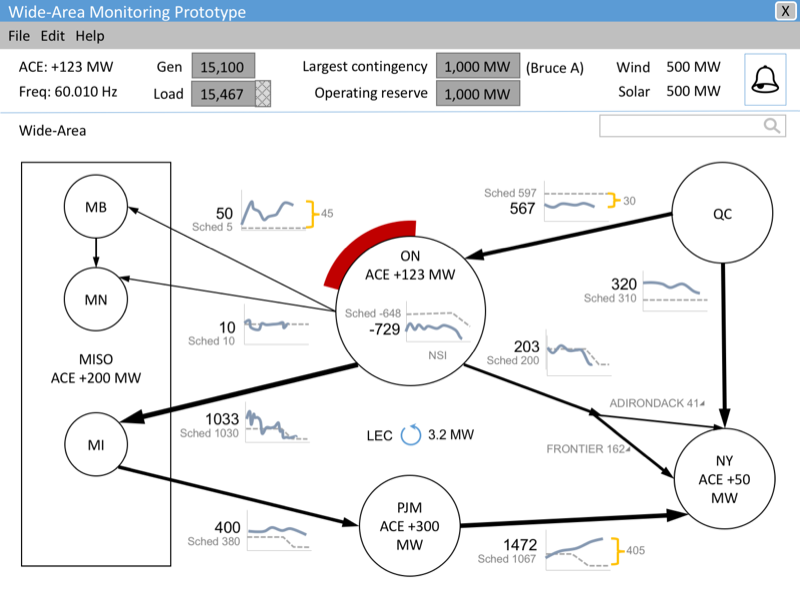
I then developed high-fidelity prototypes. I conducted usability testing where operators answered 11 task questions based on the information in the displays. They then provided open-ended feedback on what they liked about the design and what could be improved. The usability testing ended with a questionnaire, including questions from the System Usability Scale (SUS).

Nine out of the 11 task questions were correctly answered by most participants on their first time seeing the prototype and without training on the design. A few design changes were made in the final iteration of the prototype to improve the ease of navigation and to meet the technical constraints of existing mathematical models. The prototype earned a mean SUS score of 77/90 (SD = 7), normalized to 86/100. (A SUS question on integration into a system was not applicable to this prototype, and was removed from the questionnaire.) Participants liked that the displays consolidated information that had been spread out across separate screens in their current software user interface. They believed that they could detect problems with the power grid more quickly with the new interface compared to their existing tools.
Publications
- Tran, F. F., Hilliard, A., & Jamieson, G. A. (2017). Keeping the lights on across the continent. Ergonomics in Design, 25(4), 10-22.
- Tran, F. F., Hilliard, A., Jamieson, G. A., & Johnson, L. (2016, March 30). Human factors of transmission operations: Summary principles from a collaborative research project. Presented at the NERC Human Performance Conference, Atlanta, GA.
- Hilliard, A., Tran, F.F., & Jamieson, G.A. (2016). A graphic form with emergent properties for monitoring renewable generation stations. IEEE Resilience Week (RWS), 162-165.
- Hilliard, A., Tran, F. F., & Jamieson, G. A. (2017). Work Domain Analysis of Power Grid Operations. In N. A. Stanton, P. M. Salmon, G. H. Walker, & D. P. Jenkins (Eds.), Cognitive Work Analysis: Applications, extensions, and the future (pp. 151-170). Boca Raton, FL: CRC Press.
- Tran, F.F. Designing for Wide-Area Situation Awareness in Future Power Grid Operations, Master’s thesis (2016). University of Toronto; Department of Mechanical and Industrial Engineering. (Advisor: Greg A. Jamieson).
- Tran, F.F. (2015, November 21). Design for wide-area situation awareness in future power grid operations, Inter-University Workshop on Human Factors Engineering. Toronto, ON.